When Do You Throw in the Towel On Your Struggling Project?
December 12, 2011 | Comments | customer development process, data analysis, startups
Vinicius Vacanti is co-founder and CEO of Yipit. Next posts on how to acquire users for free and how to raise a Series A. Don’t miss them by subscribing via email or via twitter.
 One of the hardest decisions you have to make, as an entrepreneur, is deciding when to give up on your current struggling project. It’s made especially difficult because you always seem to have an exciting new idea rattling in the back of your head.
The difficulty of the decision is further exacerbated by:
- Conflicting accounts from previous startups. On the one hand, you hear about how AirBnB struggled for years before finally making it. But, then you also hear how the founders behind Stickybits, after struggling for almost a year, dropped the project and built Turntable.fm.
- Sunk cost. You’ve spent so much time on your current project, can you really walk away now? Do you want to tell your friends and family that you’re, yet again, starting on a new project? Do you want to admit you “failed” again?
- New ideas seem better than they are. Your new idea is in the “informed pessimism” stage. It probably has all sorts of complications you haven’t thought about.
What if you quit right before your startup was about to take off? What if that other idea in your head is your Turntable.fm?
You Need a Framework
With such an emotional decision, it’s best to try to be as systematic and rational about it as possible.
The key to making this decision comes down to: (1) quickly iterating the product based on learnings and (2) consistently measuring each iteration based on a defined success metric.
Since things like frameworks work better with examples, I’m going to imagine I had the idea for TaskRabbit, the app where you can post tasks for people to do at a price, and that I was just getting started with the idea and struggling.
Defining a Success Metric
There are many possible success metrics and it depends on your business.
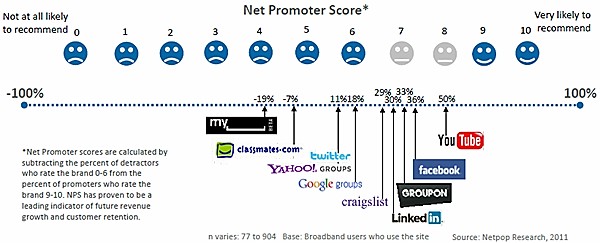
One of the more popular generic success metrics is the net promoter score. Basically, the score tells you how likely your users are to recommend your app. If the majority of your users aren’t “promoters”, you’re not going to make it. For more on this metric, see Eric Ries’s excellent post.
Here’s the net promoter score of some well-known apps:
But, you can use almost any metric like:
- Conversion rate of people who, after clicking on a facebook ad, create an account after demo-ing your product
- Percentage of people that invite friends on your “invite” friend step after they’ve used your product
- Percentage of people that return to the site a week after signing up
- If you are selling something to consumers or businesses, then your success metric is percentage of people who agree to pay for the product
For my fictitious case study (TaskRabbit), I would go to craigslist and find people asking for help and tell them they should put their request on my new site TaskRabbit. My success metric would be the percentage of people who added the task and perhaps, after putting the task up, I would give them a net promoter score survey.
With my success metric defined, I’d be ready to start iterating.
Why You Need to Iterate
Where some entrepreneurs stumble is they are never willing to iterate their product. They have an idea for the product, they put it out, people don’t like it and they throw in the towel. It’s incredibly hard to get it right the first time. You have to iterate.
Other entrepreneurs believe their product will magically work after a while. Unless they are iterating, it’s very unlikely it’s just going to magically take off. You have to iterate, you have to do so quickly, and you have to make sure the iterations are significant.
The changes you need to make must address the fact that your project must not be delivering enough value to the user at the cost you are requesting of them. For example, your emails aren’t valuable enough for them to bother opening. They don’t like it enough to recommend to their friends. They didn’t like it enough to take time out of their day to check it again a week later. In my fictitious TaskRabbit case, it could be that just a few people on craigslist are actually putting up their tasks on TaskRabbit and my net promoter score is negative.
At this point, people will tend to think they have a marketing problem. Not enough people know about it. But, it’s almost certainly that you have a product problem.
Iterating
Before you go trying to fix your product, you should diligently note down where you currently rank your chosen success metrics. You need to make sure you get a big enough sample size to make sure your stats are accurate which can be hard to do by just talking to people in person.
Once you’ve noted your metrics, your goal is to find out why you have a product problem. You need to dig deep into the user psyche and pull out that reason.
You can give people online surveys to take, you can pay people $10 to get on the phone with you and, even better, you can bring in people to talk to you in person (via craigslist, buy their coffee at starbucks, etc.).
In my fictitious case, I finally muster up the courage to find out why TaskRabbit isn’t working. It turns out that potential users don’t trust the people who will be doing the tasks.
So, you go back to your apartment, implement a fix to the problem and release it again.
Compare Success Metrics for Each Iteration
Whatever methodology you used previously, you should do it again with new users and measure where your new product ranks on your chosen success metric.
You may find that your success metric is hugely improved and the product is taking off.
More likely, you’ll find that your success metric improved a little bit, stayed flat, or depressingly gone down.
Regardless, you need to get in touch with these new users and find out why they still don’t really want/need your product. You may find that you didn’t actually solve the problem you thought you were solving.
In the TaskRabbit example, I could have added a small bio next to TaskRabbits to make them seem more trustworthy. But, if the metrics didn’t improve, then I was wrong. I either didn’t actually address their concerns or there were other concerns that I didn’t know about. So, I could do something more dramatic like stating that all TaskRabbits have undergone a thorough background check.
Back to your apartment to iterate again.
Target States
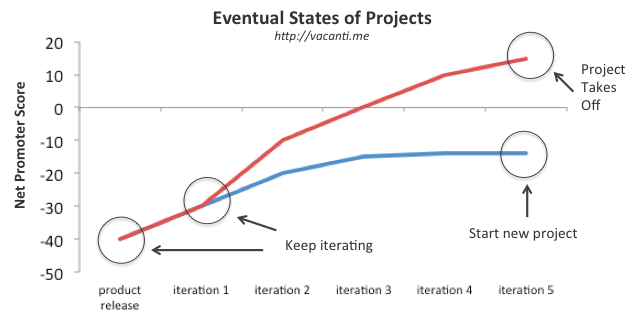
With your various iterations, you’re trying to get to two potential states:
- Success metric takes off. Your product will take off along with it. For net promoter score, it becomes positive.
- Your success metric improvement stalls. You’ve iterated several times and, while they slightly improved your metrics, it hasn’t been enough. You’ve also run out of ideas on how to continue iterating. It may be that people don’t really have the problem you’re trying to solve. Or, the way you’re solving the problem is too demanding on the user and you don’t know how to make it easier for them.
It’s Okay to Start Something New
Hopefully your various iterations will take your project to where it needs to be to take off with your audience.
However, if you are iterating, your metrics aren’t improving and you’ve run out of ideas on how to address your users’s concerns about the product, it’s okay to throw in the towel and start working on a new project. You’ll have learned a tremendous amount from your first go around and will be in a much better position to make your next idea successful.
See discussion on Hacker News.
Vinicius Vacanti is co-founder and CEO of Yipit. Next posts on how to acquire users for free and how to raise a Series A. Don’t miss them by subscribing via email or via twitter.
